Mortgage Rates Fall for a Third Straight Week, to 7.18%
Bucks Co. & Beyond Daily
Bucks Co. & Beyond Daily
by Nick Rau
Mortgage rates fell for a third straight week, reaching a national 30-year average of 7.18%, and Bucks County still has more homes for sale than in any September of the last five years. Freddie Mac's Primary Mortgage Market Survey for Nov. 5, 2026 put the U.S. 30-year fixed average at 7.18%, down from 7.24% the week before and from 7.40% on Oct. 15, while Bucks County closed September with 1,062 active listings and a $515,000 median sold price that was still up 1% from a year earlier. That means more choice on the ground than in recent Septembers, and a national 30-year average lower than three weeks ago.
The rate move is national, not a local quote from any Bucks lender, so treat it as the headline average and get a current pre-approval from your own lender before you shop. Here's how the newest Freddie Mac reading lines up with the latest Bright MLS Bucks County data. I live right here in Bucks County.
Freddie Mac's headline this week was plain: "Mortgage Rates Decline for Third Consecutive Week to 7.18%." The national 30-year fixed averaged 7.18% as of Nov. 5, 2026, down from 7.24% last week. A year ago it was 6.22%. The national 15-year fixed averaged 6.57%, down from 6.60% last week and from 5.50% a year ago. The three consecutive weekly declines run Oct. 22 (7.32%), Oct. 29 (7.24%) and Nov. 5 (7.18%), down from 7.40% on Oct. 15.
Nobody can promise where rates go from here. What you can do is update the math. If you locked a quote three weeks ago at something near 7.40%, ask your lender what today's numbers look like. If you have been waiting on the sidelines, a third weekly drop is a reason to re-run your budget, not a reason to assume the next print will be lower still.
The newest monthly Bucks County report is still September 2026. The Bucks County Association of Realtors' October Local Market Insight PDF was 404 as of this evening, so we are working from BCAR's September 2026 Local Market Insight (Bright MLS data, calculated Oct. 8, 2026) and Bright MLS's September 2026 Philadelphia Metro report (data as of Oct. 6, 2026). I covered that inventory story in depth in my fall market update; tonight the point is how those local numbers sit next to a third weekly rate drop.
Inventory is still the local headline. Bucks had 1,062 active listings at the end of September, up from 981 in August and 880 in September 2025, and that was the highest September count in the five years BCAR tracks (min 616, max 1,062, five-year September average 821). BCAR's Oct. 14 release put that about 29% above the five-year September average. Bright MLS counts that as 2.01 months of supply in Bucks, up 0.29 from a year earlier but still well under the Philadelphia metro's 2.88 months.
Prices held. The $515,000 median sold price was down 2.8% from August's $530,000, yet up 1.0% from September 2025's $510,000, and the year-to-date median of $520,000 is up 4.0% from $500,000. Closed sales landed at 529 in September (down 20.1% month over month and 3.6% year over year), while 4,730 homes have closed year to date, up 1.9% from 2025. New pendings were 535 (down 8.9% year over year), new listings 620 (down 4.0%), and sellers averaged 98.1% of original list price. Homes averaged 29 days on market in the BCAR report; Bright's median days on market for Bucks was 12, with showings at 9,880, down 10.1%.
You get two things at once that were hard to find a couple of years ago: more homes to choose from, and a national rate that is a little cheaper than it was three weeks ago. With 1,062 actives and showings down about 10% year over year, there is often more room to compare homes, read disclosures and ask questions before you write. Sales averaging 98.1% of original list price also tell you not every home is drawing a crowd, so there can be room to talk about price, repairs or closing help, depending on the property and the seller.
BCAR President Christy Manetta said it cleanly in the association's Oct. 14, 2026 release: with inventory above the five-year average, "buyers have more options and may have more time to evaluate a property and negotiate." The payment is still the hurdle, because 7.18% nationally is well above last year's 6.22%. The upside is that three straight weekly declines give you a better starting point than mid-October. Get a current pre-approval from a lender and run the numbers on your own budget rather than going by the headline alone.
Sellers still have favorable conditions on paper: Prices are up from a year ago, the year-to-date median is up 4%, and about two months of supply is a tight market by any long-run measure. A median of 12 days on market says buyers are still moving quickly on homes that are priced and presented well. What has changed is that buyers have more homes to put next to yours, and a slightly better rate environment can bring a few more of them back into the conversation.
Listings that are priced for this fall's inventory, presented well and ready for buyer questions are still selling, and September's median was still higher than a year earlier. A lower national rate than mid-October can bring more shoppers into the market; confirm with your own showing and offer activity.
Three things. First, rates: Freddie Mac publishes every Thursday at noon Eastern, and three straight weekly dips are worth watching without treating them as a forecast. Second, BCAR's October report (the September PDF was calculated Oct. 8; the October PDF was still 404 as of Nov. 5); it will show whether inventory kept climbing into the holidays. Third, pending sales and showings: if a little rate relief starts to show up in Bucks contracts, that is the signal that the third weekly drop is doing real work on the ground.
Will mortgage rates go down in 2026?
They already have, a little, on a weekly basis. The national 30-year fixed average fell from 7.40% on Oct. 15 to 7.32% on Oct. 22, 7.24% on Oct. 29 and 7.18% on Nov. 5, 2026 (Freddie Mac). That is three straight weekly declines, not a promise about the rest of the year. Nobody can guarantee the next print, so talk with a lender about your own quote and timeline.
Is it a good time to buy a house in Bucks County?
It depends on your budget and timeline, but buyers have more choice than they've had in years and a slightly better national rate than three weeks ago. Bucks County had 1,062 homes for sale at the end of September 2026, the most of any September in five years, and homes sold for 98.1% of original list price on average (BCAR / Bright MLS). Check your own payment with a current pre-approval before you shop.
Are home prices dropping in Bucks County?
Not compared with last year. The median sold price was $515,000 in September 2026, up 1.0% from $510,000 in September 2025, though down from $530,000 in August. The year-to-date median of $520,000 is up 4.0% from 2025 (BCAR / Bright MLS).
Want to see how this plays out town by town? Start with my Bucks County neighborhoods guide.
Mortgage rates fell for a third straight week, reaching 7.18% nationally, and Bucks closed September with 1,062 listings: here's what the newest Freddie Mac print means next to the latest local numbers.
I'm Nick Rau, President of Sales with the Rarity Real Estate Team, ranked in the Top 1% of agents nationally (RealTrends 2025, individual), with more than 135 Google reviews, and I live right here in Bucks County.
Rarity Real Estate Team, 1100 N Delaware Ave Suite A, Philadelphia, PA 19125 · (215) 593-7498 · [email protected]
Questions about buying or selling in Bucks County? Call (215) 593-7498 or email [email protected].
Blog · Google · Zillow · Instagram @nickraure · Facebook · LinkedIn · X · Threads
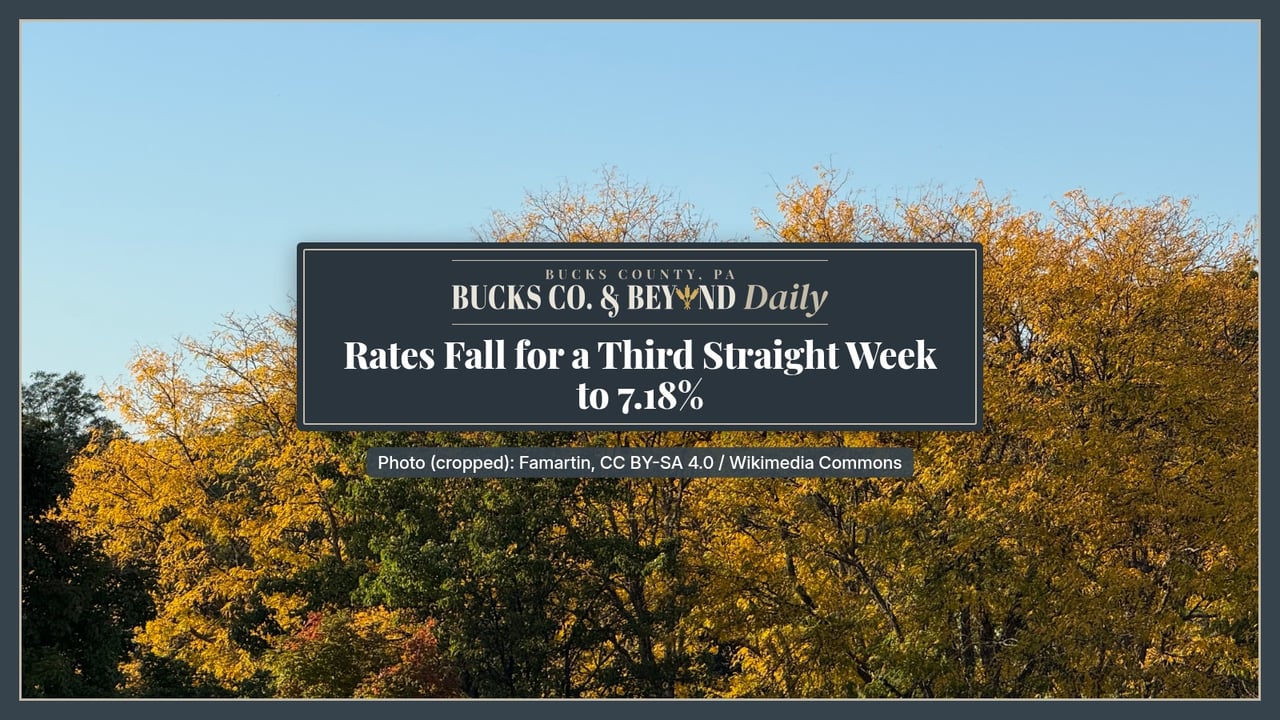
Featured image: honey locusts changing color in autumn at Community Park in Lower Makefield Township, Bucks County. Photo (cropped): Famartin, CC BY-SA 4.0 / Wikimedia Commons.
Sources (checked Nov. 5, 2026, about 7:05 to 7:15 p.m. CT): Freddie Mac Primary Mortgage Market Survey, Nov. 5, 2026; Bucks County Association of Realtors, Local Market Insight, September 2026 (Bright MLS data, calculated Oct. 8, 2026; October 2026 PDF was 404); BCAR press release, Oct. 14, 2026; Bright MLS, September 2026 Housing Market Report, Philadelphia Metro (data as of Oct. 6, 2026).
Want an agent who'll really listen to what you want in a home? Need an agent who knows how to effectively market your home so it sells? Give me a call! I'm eager to help and would love to talk to you.
